Hypothesis Testing: 3 Key Tips

When it comes to hypothesis testing, a fundamental concept in statistics and data analysis, understanding its intricacies is essential for researchers, analysts, and anyone working with data. Here, we explore three key tips to navigate the world of hypothesis testing with confidence and precision.
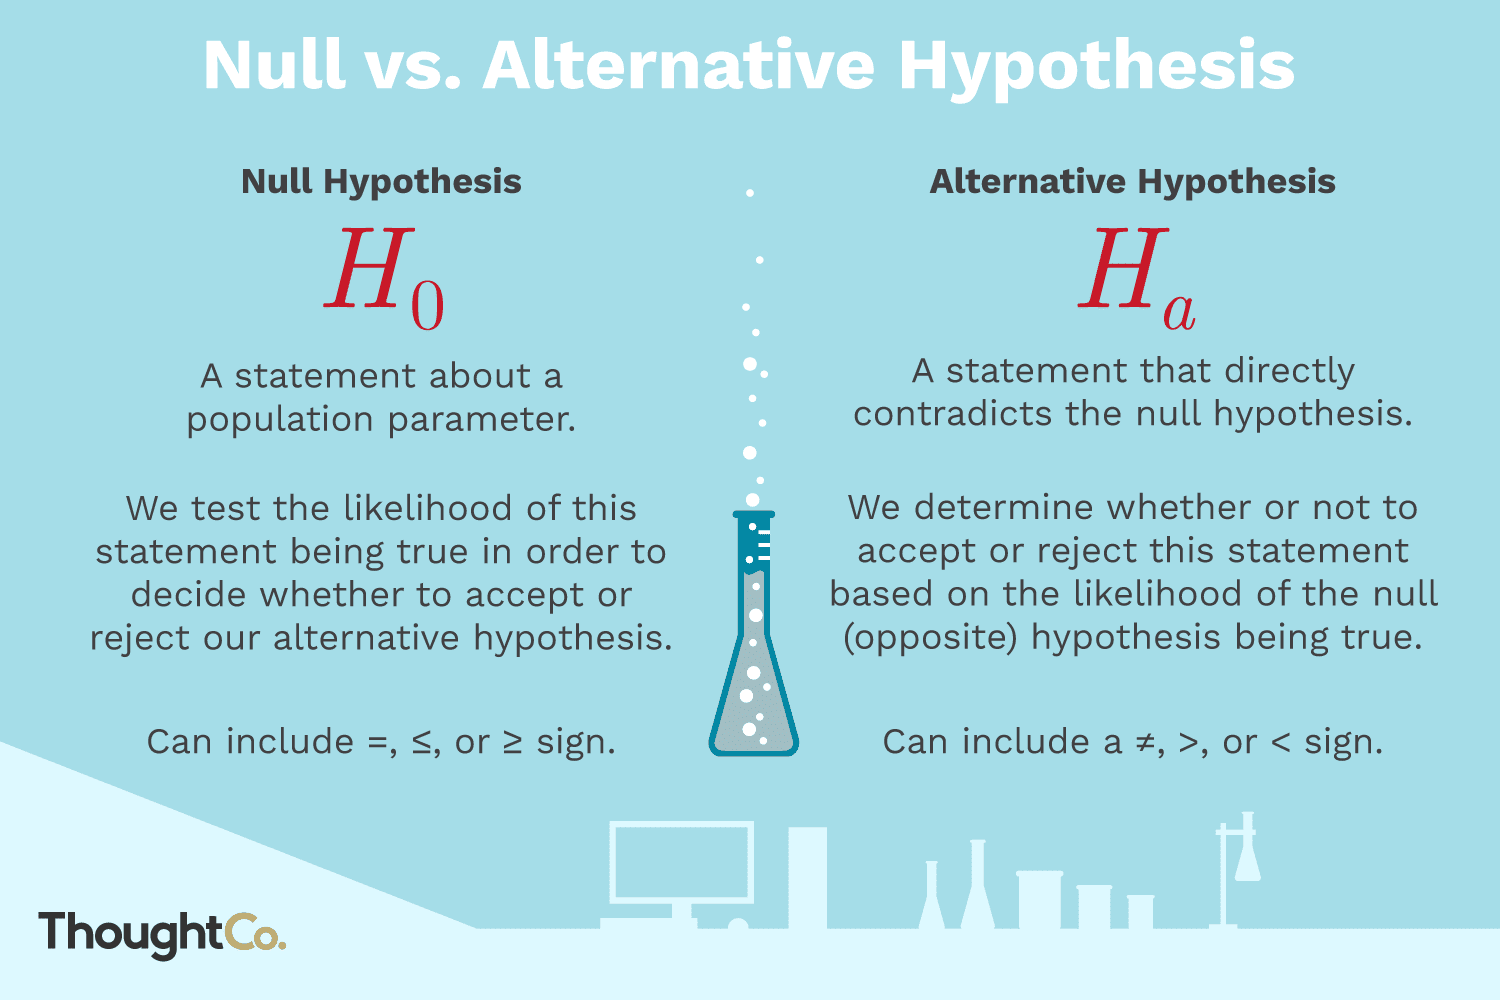
1. Understand the Null and Alternative Hypotheses: - Null Hypothesis (H0): This hypothesis represents the status quo, assuming there is no significant difference or effect. It is the default position that we start with and aim to disprove or reject. For instance, in a study about the effectiveness of a new drug, the null hypothesis might state that the drug has no impact on recovery rates. - Alternative Hypothesis (Ha): In contrast, the alternative hypothesis suggests that there is a significant difference or effect. It is the statement that researchers hope to prove. In our drug study example, the alternative hypothesis could propose that the new drug improves recovery rates compared to the standard treatment. - Importance: Clearly defining these hypotheses is crucial. It sets the direction of your analysis and helps you interpret the results accurately. Misinterpreting or confusing these hypotheses can lead to incorrect conclusions. Remember, the goal is to gather evidence to either support or refute the alternative hypothesis.
2. Choose the Appropriate Test: - Types of Tests: There are various types of hypothesis tests, each designed for specific scenarios. Some common tests include z-tests, t-tests, chi-square tests, and analysis of variance (ANOVA). Each test has its own assumptions and requirements, such as sample size, data distribution, and independence. - Considerations: When selecting a test, consider the nature of your data and the research question. Are you comparing means, proportions, or examining associations? Are your data normally distributed? Do you have paired or independent samples? The answers to these questions guide your choice. For example, a t-test might be suitable for comparing two independent means, while a chi-square test could analyze associations between categorical variables. - Advice: If you’re unsure which test to use, consult statistical references, online resources, or seek advice from a statistician. Misapplying a test can lead to incorrect conclusions and misinterpretations. Always ensure your test aligns with your data and research objectives.
3. Interpret Results with Caution: - P-values: P-values are a critical component of hypothesis testing. They represent the probability of observing the data (or more extreme results) if the null hypothesis is true. A low p-value suggests that the data is unlikely under the null hypothesis, providing evidence against it. However, it’s crucial to interpret p-values correctly. A low p-value doesn’t necessarily prove the alternative hypothesis; it simply suggests that the null hypothesis is unlikely. - Significance Levels: Researchers often use a significance level (alpha) of 0.05, meaning they’re willing to accept a 5% chance of incorrectly rejecting the null hypothesis (Type I error). However, this doesn’t mean that p-values below 0.05 always indicate significance. The p-value should be considered alongside the research context and the overall evidence. - Practical Significance: While statistical significance is important, it’s equally vital to consider practical significance. Just because a result is statistically significant doesn’t mean it’s practically meaningful. For example, a small effect size might not be worth considering, even if it’s statistically significant. Always evaluate the magnitude of the effect and its implications in the real world.
In conclusion, hypothesis testing is a powerful tool in data analysis, but it requires careful consideration and interpretation. By understanding the null and alternative hypotheses, choosing the right test, and interpreting results with caution, researchers can draw meaningful conclusions from their data. Remember, hypothesis testing is an iterative process, and continuous learning and refinement are essential for accurate insights.
Hypothesis testing is a critical skill for data-driven decision-making. By mastering these three tips, you can navigate the complexities of hypothesis testing with confidence and make informed choices based on your data.
What is the difference between a Type I and Type II error in hypothesis testing?
+In hypothesis testing, a Type I error occurs when we reject the null hypothesis when it is actually true. This means we mistakenly conclude that there is a significant effect or difference when, in reality, there isn’t. On the other hand, a Type II error happens when we fail to reject the null hypothesis when it is false. In this case, we incorrectly accept the null hypothesis and miss detecting a significant effect.
How do I determine the sample size for hypothesis testing?
+Determining the sample size depends on several factors, including the desired level of precision, the expected effect size, and the variability in your data. Statistical power analysis is a common method to calculate the required sample size. This analysis considers the desired statistical power (typically 80-90%), the effect size, and the significance level to determine the optimal sample size.
Can hypothesis testing be used for non-parametric data?
+Absolutely! While many hypothesis tests assume normality and other parametric assumptions, there are non-parametric alternatives for situations where these assumptions are violated. For example, the Mann-Whitney U test is a non-parametric alternative to the t-test for comparing two independent groups, and the Wilcoxon signed-rank test is used for paired data.
What is the role of confidence intervals in hypothesis testing?
+Confidence intervals provide a range of values within which we can be confident (at a specified level) that the true population parameter lies. They complement hypothesis testing by giving us an estimate of the parameter’s precision. For example, a 95% confidence interval suggests that we are 95% confident that the true population mean falls within the calculated interval.